
Raise your hand if you hate looking at and working with numbers. Give me five! Data is the boring dude who people in the office ignore. Most people stay clear from it except when they absolutely have to – normally during reporting periods. It’s the ugly step-son that’s tossed to the BI guy and never again welcome in our presence hence after.
But this is precisely the problem that teams and companies that want to truly succeed need to solve. Many organizations who have a difficult time using data to grow their business tend to think that they just need more snobby software, capabilities or more hotshot analysts. However, in reality there’s nothing categorically wrong with the capabilities of the analytics tools you’re using nor with the skills of your team. The reason you’re not getting value from your data is simple. Your team is hardy looking at and using your data. Why? Because it’s a “pain in the bit” to use and they hate it! Let’s break this down and look at 3 reasons why getting your team to love using data is crucial to using it.
- They’ll Use Data More Frequently
I recall the other day having a discussion with a fellow Ptminder, Ben, a partner crime in all things digital marketing. We were discussing several options for a lead capture campaign we wanted to run and wanted to pull up some data from Google Analytics to support our direction. Merrick, our rowdy analytics guy listening in on the conversation immediately got to work tinkering with the GA reports. Several dozen clicks, finger points, windows and frustrations later, we almost got the data we wanted but hated to be late for an important lunch. So I stopped everyone in their tracks and asked Merrick to instead open up Datadeck, which was a much simpler and relaxing interface that integrated with GA, but which allowed us to quickly drag and drop the data we wanted to see in literally 2 clicks. It felt great, I felt good for delivering and everything calmed. Had it not been for this simpler and more intuitive option, I’m certain the matter would have been left hanging as we sped away to fill our stomachs.
Looking back on that situation, I’m not surprised why most people aren’t really touching their analytics tools as much. They hate experiences like the one I outlined above. What I’ve noticed is with this type of experience with their data, people are only consulting their data under the most forced, limited and crucial circumstances. Yet there are dozens of opportunities a day to access the right data for the problem you’re trying to solve. If you want yourself and your teammates to use data at every opportunity you can as opposed to only 1% of the time, you’ll have to get rid of processes they hate and make the experience relaxing and seamless. Two-click, drag and drop experiences, beautiful usability and comforting design make all the difference in lowering blood pressure and giving people their mojo.
- They’ll Actually Start Collaborating Around Data
Some of the best ideas aren’t planned for and created in formal settings. They often happen effortlessly in the heat of exchange where people jive off of each other’s thoughts and create innovative sparks with their chiming. At most companies, data isn’t adding to the conversation at that level. People aren’t throwing and contributing insights they found back and forth to stir discussion towards data-driven innovation. Who can blame them? We all love having beers in our imaginariums where we bounce ideas and strategies off each other but data is again that numerical eyesore that people hate inviting to the party.
For example, there’s no way I’ll burn myself out hunting down and then digging through the right spreadsheets every time I want to drop a data-driven sentence or two into each of the countless discussions and brainstorms we hold on a daily basis. On the other side, no one’s going to bother trying to understand that wall of numbers right in the middle of their creativity. If however, you were to make the process enjoyable, slick and easy, the entire situation would change.
What if, instead of having to spend twenty minutes messing with a single spreadsheet, all I had to do was (while talking) spend a few seconds to just drag and drop the data I wanted from my spreadsheets (without having to know what they look like or even where they are) onto a dashboard that automatically displayed the info using beautiful and clear visualizations as opposed to numbers? I could then quickly go “But hey Jack, check this out” and feel super slick and in-the-zone for doing so. John might then go “but have you seen this?” and drop another chart on me. Boom! Act! Data-driven team work! Talk about making data the life and soul of the party!

- They’ll Be Passionate About Work
Let’s face it. The Data revolution may still have some kinks to work out, but it’s already here. Working with data is bound to be a core company requirement regardless of job description and the level of involvement in a person’s daily work is just going to grow. Those who learn to live, breathe and love data are going to be ahead of the pack and find data a best friend they can’t live without. On the other hand, those hating it are going to be stressed out. It’ll get to a point where hating data will equal hating the job, and that’s not something that defines a data-driven company.
Data tools are going to have to feel increasingly like iPhones. Everything from the color of the interface to the pop-up messaging will have to be on-point and make the experience as frictionless as possible. Minor issues such as the feel of the mouse or touch screen to strategic functions such as minimizing the steps it takes to getting that pay-off from data will all be equally crucial. Also, did anyone mention AI? After all, it’ll become that workmate that sticks to you day and night, and we know how certain people can quickly get on your nerves if they rub you the wrong way.
Getting into the Love.
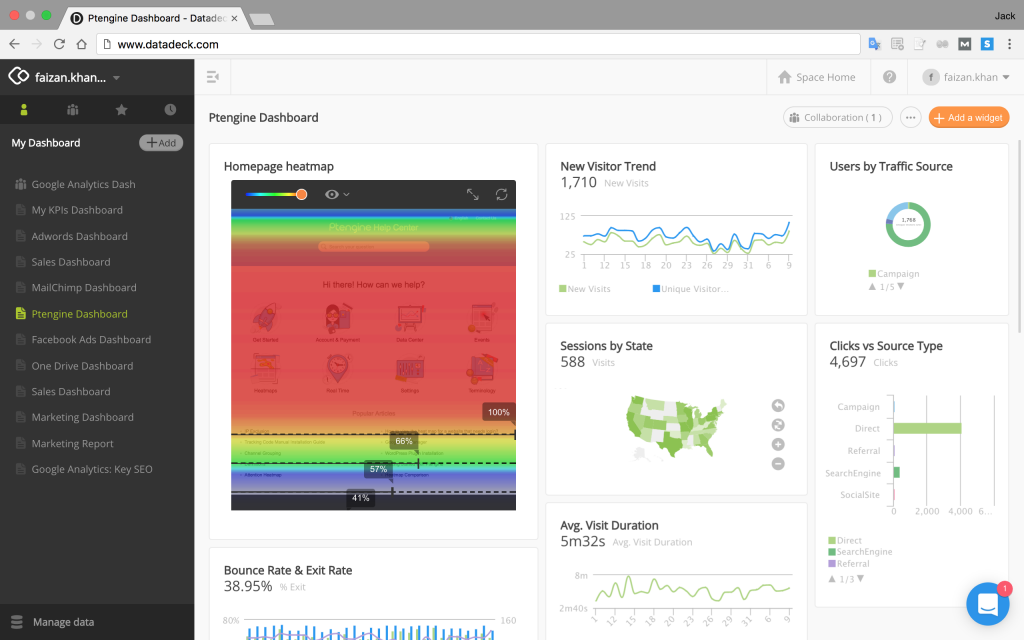
This is the direction we’re taking with Datadeck. We understand the industry needs to change and that data needs to shine more so it can help its users shine more. There’s a lot more work to be done and we’ve begun with the important first steps: We bring all your data into a single easy to use interface that lets you sit back, relax and drag and drop the key points from your data (without having to know where it actually is or switch to the tools the data originally sat in) and generate actionable insights instead of working with complex multi-step workflows. These insights can then easily roll hot off the press into the hands of teammates who can see and comment on crystal clear trends made visual. Most importantly, everyone on your team can jump in and do the same thing: pulling, sharing and acting on insights from all of your data like it’s nobody’s business.
Stop hating your data and make insights widespread in your team.
About The Author: 请记住
More posts by 请记住